


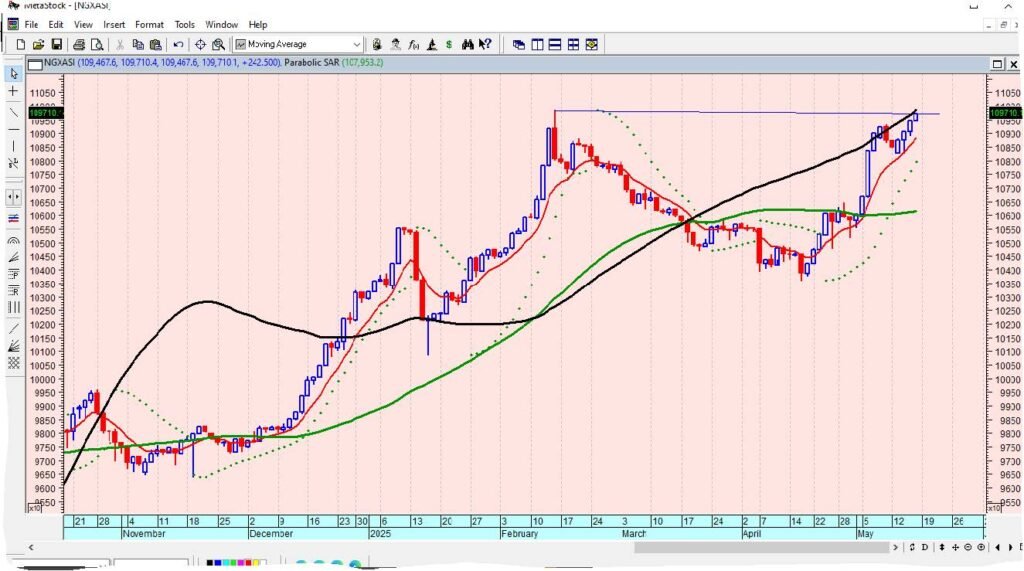
The long bullish run on the NGX is likely to continue, with the index action set to breakout the all-time high of 109,850.83 level and the 200-day moving average again on a strong buying sentiment and momentum that had supported many stocks to hit new 52-week highs in the face of shifting economic fundamentals and better than expected corporate earnings of listed companies.
The V shape chart pattern of the index action indicates inflows of funds in the equity space that had reflected on the buying interest across the low, mid and highly priced stocks to sustain this recovery and uptrend, which has been supported by improving volume, as the market currently trade relatively above its daily average on expanding positive market internals.
Profit taking or pullbacks at this stage of the markup phase of NGX creates opportunity for new entrance and at the same time add more power for the index to trend higher.
Stocks trading and investing are back in business after one month and some weeks setback on profit booking in March and first half of April after mega companies and sectors had announced their audited financials and corporate actions, coupled with the wave of tariffs war emanating from US trade policy that triggered global stock markets selloffs and fear of economic recession that weighed on market players.
The first quarter 2025 financials that started hitting the market at the mid of April changed the seemingly worst investor sentiment and volatility, with impressive numbers from Nigerian Breweries and others triggered position taking in the consumer goods sector and others.
As more corporate scorecards beat expectations ahead of their corporate actions of dividend qualification date and payment.
These fuelled the positive momentum, as players took advantage of earlier pullbacks and stronger Q1 earnings reports to reposition their portfolios in the midst of bargain hunting and sector rotation.
Even as the month of May has brought a wave of uptrend as a way of repeating history of being active on the NGX, after recording 18 times of positive close in the past 27 years and down just 9 time to defy the trade mantra of sell in May and come back in October.
The above reasons were enough to push NGX index decisively up towards its 200-day moving average for the second time in over two months.
The last two times that happened in 2025 bull market (the bull market never technically ended in the index), stocks continued soaring to new all-time highs (see chart below: the red line is the T line, green is 50MA while black line is the 200-day moving average).

Does that mean the same thing will happen this time? Certainly not.
In fact, the first time the NGX index cross the 200-day line during the current bull market in December 24, 2024 the rally continues for two weeks, and the index pulled back below its 200-day line and rebounded briefly to rally for another one month till mid February 2025.
Given that selloffs and volatility in the downtrend lasted for two months till April 16, 2025 before this uptrend that signalled recovery and likely a breakout of all-time high of 109,850.83 bps.
Why the 200-Day Moving Average Matters
Still, the 200-day line is an important technical hurdle, and one that was far from the index action at the beginning of this month.
Getting back above the black line before retracing down in a mirror correction, and the bull market continue; the last two times it happened, stocks continued to rise for an average of one month and three weeks. There is real momentum in the market after Q1 earnings season and mixed macroeconomic indices.
Technical analysis can often be viewed as psychology and sentiment by some investors, but in some cases it can offer up important historical “tells” like this one.
There is a reason the 200-day line has largely acted as a line of distinction during this bull market, as stocks have traded mostly above that threshold; when they have dipped below that line, it is fallen into correction territory. 5
Conversely, the 200-day moving average acted as a support and resistance since October 2024.
The black line worth paying attention to. The fact that the chart above shows that the NGX’s index has been below the black line for past two month as it is heading for a breakout of line shows the market is still healthy. And now that the market is back to its all time high, you should take it as a green light to deploy some of your excess cash on stocks that have been on your watch list or to expand portfolio positions that you like most. As you, also allow buying and selling volume to guide your trading decision.
Sentiment Report for the week ended May 16, 2025
NGXASI buy 100% volume index 1.09 MFI 57.41D
Abbey sell 100% volume index 0.71 MFI 82.40U
Abc buy 35% sell 65% volume index 1.48 MFI 91.95U
Academy buy 39% sell 61% volume index 1.81 MFI 64.80U
Accorp buy 100% volume index 0.96 MFI 28.28D
Afriprud buy 39% sell 61% MFI 68.17D
Aiico buy 13% sell 87% volume index 1.72 MFI 44.28U
Berger buy 100% volume index 1.58 MFI 63.03U
Beta buy 100% volume index 2.52 MFI 100.00
Cadbury buy 0% volume index 1.75 MFI 70.99D
Caverton buy 81% sell 19% volume index 4.89 MFI 85.04U
Chams buy 92% sell 8% volume index 0.92 MFI 57.75U
Cileasing buy 100% MFI 61.87U
CHH buy 100% MFI 60.17D
Corner buy 100% MFI 44.66U
Custodian buy 0% MFI 28.91U
Cutix buy 67% sell 33% MFI 19.47U
CWG buy 100% volume index 2.19 MFI 69.39D
Daar buy 82% sell 18% volume index 0.73 MFI 31.27U
Dangsugar buy 9% sell 91% MFI 43.64U
Deap buy 0% volume index 3.17 MFI 26.15D
Ellah buy 60% sell 40% volume index 1.17 MFI 34.33D
Eterna buy 0% volume index 3.78 MFI 52.19D
Etranzact buy 100% MFI 42.17D
Fcmb buy 60% sell 40% volume index 4.91 MFI 19.20D
Fidelity buy 87% sell 13% volume index 0.98 MFI 66.50U
Fidson buy 96% sell 4% volume index 4.31 MFI 79.36U
FHC buy 27% sell 73% MFI 53.90D
Ftn buy 79% sell 21% volume index 4.62 MFI 70.07U
GTCO buy 32% sell 68% volume index 1.43 MFI 58.03U
Guinea buy 43% sell 57% volume index 1.59 MFI 19.99D
HFM buy 100% volume index 1.39 MFI 78.25U
IEI buy 14% sell 86% volume index 4.96 MFI 60.66U
Jaiz buy 53% sell 47% MFI 34.84D
Jagold buy 42% sell 58% MFI 38.72U
Johnholt buy 100% volume index 0.99 MFI 62.32U
Lasaco buy 100% MFI 35.36D
Learn sell 100% volume index 1.49 MFI 36.12U
Linkass buy 100% volume index 1.87 MFI 42.11D
Lvstk buy 38% sell 62% MFI 69.45U
Mansard buy 100% MFI 40.15U
M&B buy 83% sell 17% volume index 3.51 MFI 74.44U
Mben buy 90% sell 10% volume index 1.28 MFI 68.89U
Mcnicho buy 100% volume index 5.37 MFI 57.20U
Mtnn buy 75% sell 25% volume index 2.87 MFI 46.85U
MLTVS sell 100% volume index 2.52 MFI 74.82U
Nahco sell 100% volume index 0.92 MFI 72.73D
Nascon buy 100% volume index 0.72 MFI 76.64U
Neimeth buy 100% volume index 6.34 MFI 81.36U
Nem sell 100% MFI 59.79D
Nestle buy 100% volume index 1.50 MFI 89.78U
NGXGR sell 100% volume index 1.68 MFI 63.71D
NNFM buy 100% volume index 3.79 MFI 71.07U
NPFMC buy 100% volume index 3.50 MFI 81.35U
Oando buy 78% sell 22% volume index 0.92 MFI 47.65U
Okomu buy 100% MFI 81.62D
Omatek buy 100% MFI 25.75U
Prestige buy 80% sell 20% MFI 21.52U
Regalins buy 33% sell 67% MFI 37.50U
Royalex buy 100% MFI 57.21U
RTB buy 100% volume index 1.00 MFI 36.58U
Sovrenins buy 17% sell 83% MFI 61.20D
Stanbic buy 100% volume index 1.81 MFI 54.16U
Sterling buy 54% sell 46% MFI 65.65D
Sunu buy 100% MFI 51.57U
Tantalizer buy 25% sell 75% volume index 2.47 MFI 56.20D
Tip buy 12% sell 88% volume index 1.71 MFI 94.90U
TPlc buy 58% sell 42% MFI 60.39D
Uba buy 91% sell 9% MFI 43.88D
Ucap buy 74% sell 26% volume index 0.74 MFI 19.47D
Univinsure buy 100% volume index 0.90 MFI 51.50U
UPDC buy 62% sell 38% MFI 63.62D
Upl buy 10% sell 90% volume index 3.16 MFI 15.53D
Veritas buy 80% sell 20% volume index 1.45 MFI 44.14U
VFD buy 33% sell 67% volume index 10.53 MFI 41.27D
Vitafoam buy 100% volume index 0.88 MFI 79.49U
Wapco buy 100% MFI 45.01D
Wapic buy 9% sell 91% MFI 39.87D
Wema buy 42% sell 58% volume index 0.81 MFI 65.88U
Zenith buy 41% sell 59% volume index 1.12 MFI 42.21D
Investdata Weekly Sentiment Report
Read the full article here


